


Why is MDTA intentionally distorting traffic data used to locate a second bay bridge?
I recently attended the Chesapeake Bay Crossing Study information meeting held in Chestertown by the Maryland Transportation Authority (MDTA). They displayed a number of information panels around the room showing what they claimed was an unbiased presentation of the data they have collected thus far.
Unbiased? I was shocked by the graphic panel depicting the flow of traffic to and from Maryland counties affected by the Bay Bridge. On this crucial information panel (shown below) they relocated the high-traffic counties to make it appear as though the main flow of traffic occurs between points situated north of the Bay Bridge.
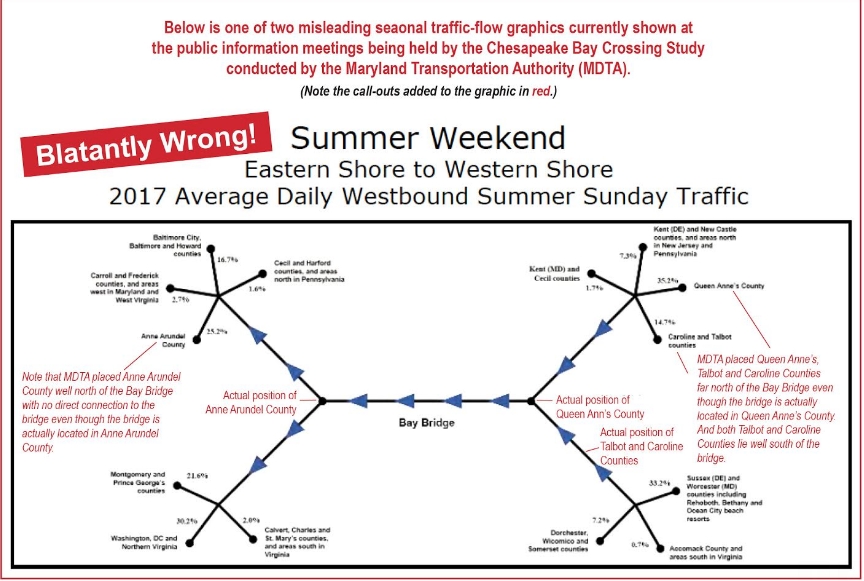
The actual percentages tell a very different story than the visual message displayed in their information panel. The fact that MDTA put time and effort into creating this blatant distortion of the facts, suggests that they have a hidden agenda. It looks like they’re trying to build a case for locating the proposed new bridge north of the current one, even though the data show that a northern route would do little, if anything, to reduce traffic on the existing bridge. Comparing their panel to the map below shows how counties were relocated on MDTA’s graphic to alter the facts.
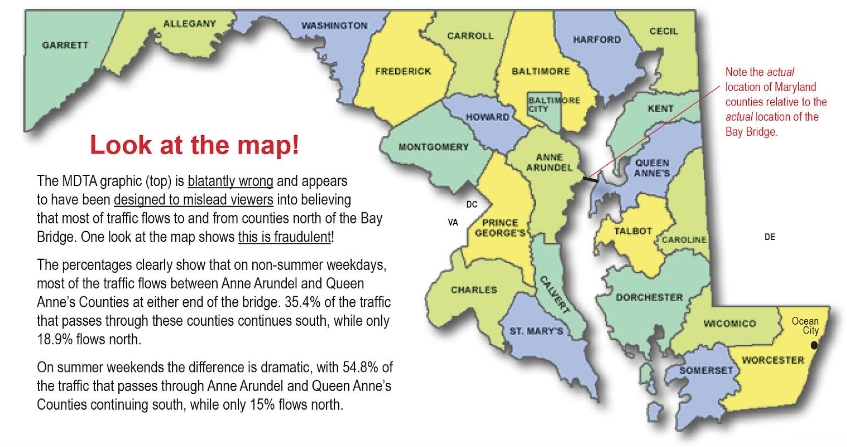
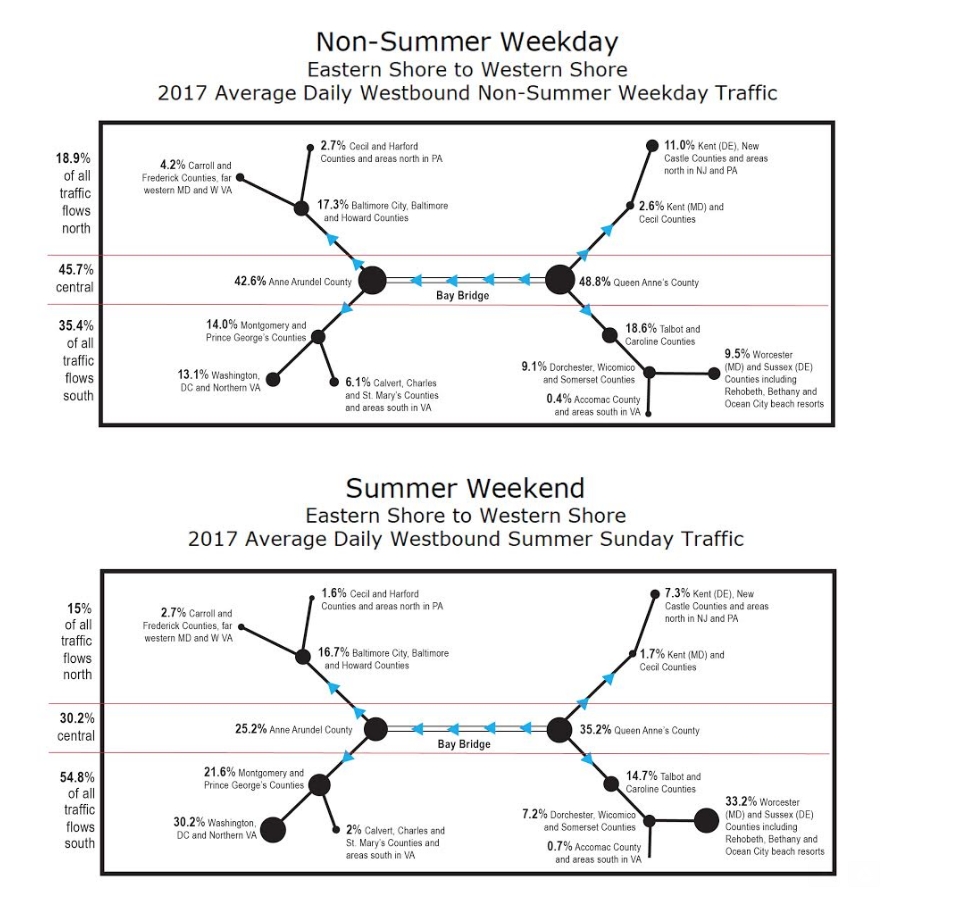
The charts below have been corrected to show the affected counties as they are actually located relative to one another and to the Bay Bridge. The size of the circles used to show each location reflects the percentage of motorists traveling to and from these locations. The total percentages of traffic flowing in each direction are shown to the side.
I sent this “errant display” notice along with the graphics to MDTA a few weeks back and waited for their reply before submitting this article to the Spy. This week, I received the typical “Your comments are important to us… and will be incorporated into the project record” reply. There was no acknowledgement of the glaring errors in their information panels or a willingness to correct them, even though the public meetings are continuing around the region.
For Maryland residents to participate in this decision-making process we must have all the facts presented accurately and without bias. Intentionally distorting the data to make a fraudulent case for one location over another is despicable. We residents must all be vigilant going forward to make sure we don’t get railroaded by our own state officials.
Readers can view MDTA’s entire presentation including the errant traffic-flow panels here.
Zane Carter is a retired advertising executive who now lives on the Eastern Shore of Maryland.
Edward Plaisance says
Most informative and much clearer presentation.
Do you have the same breakdown for traffic going East?
I presume it would be very similar, especially in the summer. I imagine the majority of the extra summer traffic going West is returning from the beaches.
Rick Balaban says
Zane Carter has identified a classic example of using misleading graphics to tell a false story. Graphics can be used to simplify and clarify… think of the London Underground ‘Map…or to confuse and obfuscate, as Mr Carter has identified here. The MDTA has been caught red handed and should be ashamed of themselves. Mr Carter should be applauded. Thanks Zane.
David Foster says
Thank you Zane for pointing out a glaring error in the MDTA presentation. Interestingly, when I looked at that same chart during the presentation, I focussed only on the percentages and the counties involved, not the graphical presentation, but you are right, MDTA made a gross and misleading error and it is one that needs to be corrected.
Sadly, that misleading graphic was not the only error that day. You may have also noticed a group of bridge opponents chanting: “What is the most important industry in Kent County? AGRICULTURE. they responded.” This too was very misleading because when it comes to the number of people employed and average wages, Agriculture is not even among the Top Five industries in Kent County.
The Bridge issue is very important to the future of Kent County and that makes it all the more important that all of us get out facts straight and be careful how we present them.
Janet Christensen-Lewis says
David, please tell us what opponents are stating that agriculture is the most important industry in Kent County. Since you put it in quotes, you must have a reference.
What has been stated is that the impact on prime farmland, 77% of farmland in the county, would be severely impacted by a bridge.
What has been stated is that farming is a major economic contributor to the County and the State.
What is important to remember is that farms in Kent County do not only contribute to economic base of the county, they provide open space, recreational resources (hunting and fishing) wildlife habitat, carbon sequestration, groundwater recharge and flood control. Do other industries in Kent County contribute in these ways?
What has just been published by the American Farmland Trust is that development of farmland in general and the even more egregious loss of prime soils to development in the US is a threat to National food security. We have only 17% remaining of the entire land mass of the continental US considered to be in the category of highly productive prime farmland.
What has been highlighted is the guideline for the NEPA process 40CRF1508.27(b)(3) state is that “Unique characteristics of the geographic area such as proximity to historic and cultural resources, park lands, prime farmland, wetlands, wild and scenic rivers, or ecologically critical areas”. MDTA failed to include prime farmland in their presentation boards at the public meeting.
What is being point to is the statement by the Council on Environmental Quality in implementing NEPA “Because prime and unique agricultural lands are a limited and valuable resource, the Council urges all agencies to make a particularly careful effort to apply the goals and policies of the NEPA and to obtain necessary assistance in their planning processes so that these lands will be maintained to meet our current needs and needs of future generations.”
Our farmland has protected our open space, our cultural and historic resources, provided the backdrop for a lifestyle that many enjoy, attracts tourists, and those that own 2nd homes. Indirectly all of this has an impact on Kent Counties Economy.
Numbers on a spread sheet don’t encompass all the “facts”
Marian Fry says
David,
Food security means assuring we have enough consistent food production in every area of the state and nation to provide for our daily needs. Reduction of the agricultural land mass through development, and the subsequent loss of farmers, is becoming a critical issue. Regardless of where agriculture ranks economically in county contribution, it has a significant role in our national security.
Patrick Byrne says
As they say in movies “follow the money”! In this case the money will equal land, and whoever can help steer the bridge to the “correct” land gets the money.
Seems as though the person developed the graphic with the assistance of someone who wants to tell a distorted storyline.
James Reefves says
The original map was not drawn to scale in order to make it fit the format. The data shows the traffic flow regardless of its physical location. It’s fine to be against the bridge into Kent County; just keep your argument logical. Otherwise, your argument against the bridge loses its credibility. You’ll never stop the bridge if you sound like a crackpot.
Joan Berwick says
My thoughts exactly James R. The graphic was not intended to portray actual geographical locations of the counties themselves.